Radha Malani and Sneha Thomas
The Government of India must maintain and publish the Assets Register to supplement Finance Accounts and promote fiscal transparency as mandated by the Fiscal Responsibility and Budget Management Act, 2003. This makes disclosing fixed assets held by GoI a requirement. A closer look reveals challenges and opportunities for India’s public asset management.
Introduction
Assets are resources that generate future economic benefits, whether through income, service delivery, or enhanced productive capacity. They serve as stores of wealth, enabling value to be created, sustained, and transferred over time. Crucially, assets are not passive holdings; they shape the economy’s productive base and influence long-term growth. Assets take on a distinct developmental role when held by the state.
Public assets—those built, owned, or controlled by the government—reflect the use of resources mobilised from citizens and other sources, and form the backbone of public service delivery and economic infrastructure. They enable the provision of public goods, support economic activity, and generate spillover benefits across sectors and over time.
As stewards of public resources, governments bear a fiduciary responsibility to ensure that these assets are created, maintained, and utilised efficiently so as to maximise social and economic returns. Their systematic recording and management are therefore integral to sound public financial management, informing fiscal sustainability, expenditure quality, and long-term development planning. Central to this is the asset register, a systematic inventory recording asset types, valuations, custodians, and conditions, which supports fiscal policy, sectoral planning, maintenance budgeting, and evaluation of public investment efficacy.
However, what is counted as an ‘asset’ within such registers is not merely a technical detail, it shapes how we interpret public investment and state capacity. In India, public assets are broadly classified into two categories. Non-financial or physical assets include land, buildings, roads, bridges, machinery, and vehicles, which directly support service delivery and expand productive capacity. Financial assets include loans and advances to states or public entities, equity investments in public sector undertakings, and securities such as bonds. These assets represent financial claims on future returns rather than the creation of tangible, productivity-enhancing infrastructure.
This expansive classification, embedded in the General Financial Rules (GFR) and the Government Accounting Standards Advisory Board’s (GASAB) asset accounting framework, aims to present a comprehensive view of public wealth. At the same time, it complicates interpretation by combining assets that differ fundamentally in their economic function, potentially obscuring the extent to which public spending is building real economic capacity. India’s approach to classifying and recording public assets also differs from international practice.
International practice takes a narrower approach. Under IMF Government Finance Statistics guidelines, the emphasis is placed primarily on non-financial assets given their direct contribution to service delivery and economic capacity. Similarly, in countries such as the United Kingdom and Australia, asset reporting frameworks place greater weight on physical assets to enable a clearer assessment of capital formation. The contrast is not merely definitional. It is central to assessing whether rising asset stocks and capital expenditure reflect the creation of durable infrastructure or the accumulation of financial claims whose impact depends on underlying performance.India’s recent focus on headline capital expenditure therefore calls for scrutiny beyond aggregate measures. Capital expenditure encompasses more than simply expenditure on asset creation. For example, large infrastructure projects, such as roads, are commissioned over multiple budget years and appear across capital expenditure figures. Asset reporting requires that public assets be recorded only upon completion, rather than recording the spending on it across years. Thus, the current structure of asset formation risks overstating capital deepening while masking gaps in foundational infrastructure. Therefore, a more careful assessment of the composition, quality, and utilisation of public assets is thus essential to gauge whether public spending is truly reinforcing the foundations of sustained growth and effective service delivery.
FRBM Act Ushers in India’s Asset Register
The Fiscal Responsibility and Budget Management Act, 2003 (FRBM Act), was introduced to establish a legal framework aimed at reducing the Central Government’s deficit and debt to sustainable levels over the medium term, ensuring fairness across generations in fiscal planning and long-term macroeconomic stability.
A key part of this framework is greater disclosure. The Act requires the government to present additional information alongside the Union Budget to give a more complete picture of its finances. These disclosures (D-1 to D-5), mandated under the FRBM Rules, are meant to supplement the Finance Accounts, which are prepared on a cash basis and do not capture the full fiscal position of the government. One such disclosure is the Asset Register (D-4). This was introduced to provide a clearer view of what the government actually owns. It records the value of major assets, both physical and financial, held by the Government of India at the beginning and end of each financial year, along with the additions made during the year.
The FRBM Act prescribed the format to compile the Asset Register, with some caveats. It only includes assets valued above ₹2 lakh, excluding smaller assets from the dataset. The ₹2 lakh threshold for including assets in the register also has consequences that are more operational and granular than systemic. By recording only items above this value and collapsing smaller assets under broad ‘Others’ headings, the format sacrifices detail on low‑value but numerically large categories of capital—such as office equipment, small tools, and dispersed infrastructure components—potentially limiting the usefulness of the register for asset‑management, maintenance scheduling, and internal audit follow‑up. In practice, this thresholds‑driven aggregation can obscure emerging maintenance backlogs and replacement needs, especially in field‑level departments where small‑value capital is widespread.
More significantly, entire sectors—such as defence, atomic energy, and certain central agencies—are left out. While this is likely due to national security considerations, it means that the register does not present a complete picture of the government’s asset base. These domains encompass large, capital-intensive assets including military and police infrastructure, nuclear facilities, and other defence and government machinery infrastructure– whose scale and value is not publicly disclosed.
As a result, the reported asset base understates the government’s true capital stock and obscures the true scale and composition of public capital as well as the obligations associated with its maintenance and renewal. This constrains a meaningful assessment of the sustainability, quality, and allocative efficiency of public investment over time. It also limits transparency and weakens intergenerational fairness in fiscal planning, as key stakeholders are required to evaluate the government’s fiscal position on the basis of partial information.
How Has India Fared in Terms of Asset Creation?
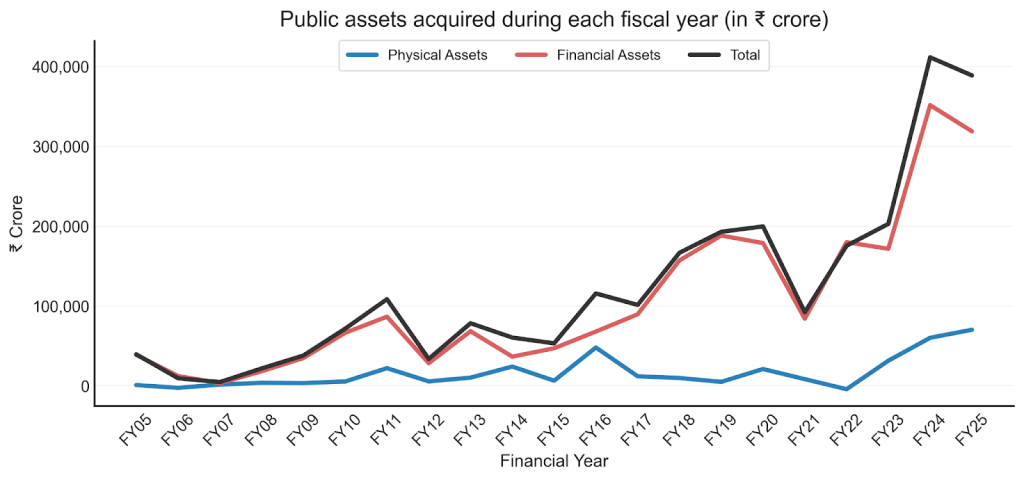
Over the past two decades, assets acquired during the year have expanded substantially, rising from approximately ₹39,000 crore in FY2005-06 to nearly ₹3.9 lakh crore in FY2025-26. However, this expansion has not followed a stable trajectory. Instead, it is characterised by pronounced surges interspersed with periods of contraction, indicating that asset formation has evolved through episodic increases rather than sustained accumulation. These surges are driven by identifiable policy factors, including fiscal stimulus cycles (such as the post-Global Financial Crisis expenditure push in FY11 (₹71,334 crore, up from FY09’s ₹37,719 crore), PSU recapitalisation (contributed to the FY11 peak (₹1.08 lakh crore), including Tier-1 capital infusions to public sector banks and equity for power assets in entities like National Thermal Power Corporation), political and election cycles align with pre-poll spikes (FY11 ahead of UPA-II polls and FY19 before the 17th Lok Sabha elections), and infrastructure‑led countercyclical policy (sharp increase post FY21 amid economic recovery and Atmanirbhar packages).
This volatility is not inherently undesirable if it reflects countercyclical policy, as higher expenditure during downturns can support macroeconomic stabilisation. However, it may undermine execution efficiency and the continuity of multi-year investments. This uneven trajectory is also reflected in the compound annual growth rate (CAGR), which captures the average annual growth over time, of cumulative assets computed for five-year intervals- slowing from 6% in FY2005-10 to 5% in FY2010-15, before rising to 14% in FY2015-20 and moderating to 13% in FY2020-25. Building on the uneven but rising trajectory of overall asset acquisition, the composition of assets acquired during the year points to a clear structural pattern in which financial assets account for the bulk of variation in aggregate trends. Changes in total asset acquisition closely track movements in financial assets across the period, whereas physical assets remain relatively smaller in magnitude and display a more irregular and episodic pattern. Financial assets accounted for about 60% of total asset acquisition in FY2014-15 and exceeded total net asset acquisition in FY2022-23 due to a net decline in physical assets. Despite this variation, it remains consistently high in most years, generally around 80-90%, indicating a sustained dominance of financial assets. In FY2025-26, this share stood at 82%.
When the expansion in asset creation is driven predominantly by financial assets rather than physical assets, it raises important concerns about the quality and developmental impact of public investment. First, a financial-asset-heavy profile weakens the crowding-in role of public investment. Unlike physical infrastructure, financial flows such as loans and equity injections do not create complementary assets that lower costs or expand opportunities for private firms, limiting their ability to stimulate private investment. Second, it complicates planning and execution. Financial allocations are less anchored to project pipelines and timelines, and their volatility can crowd out sustained, multi-year infrastructure projects, contributing to persistent gaps between budgeted and realised capital expenditure. Third, the macroeconomic impact is more muted. Evidence suggests that physical infrastructure carries significantly higher fiscal multipliers than financial transfers, with stronger spillovers to output, employment, and demand for core sectors such as steel and cement. Finally, a reliance on financial asset accumulation, often through PSU balance sheet interventions, risks shifting fiscal strategy toward short-term balance sheet management rather than durable capital formation.
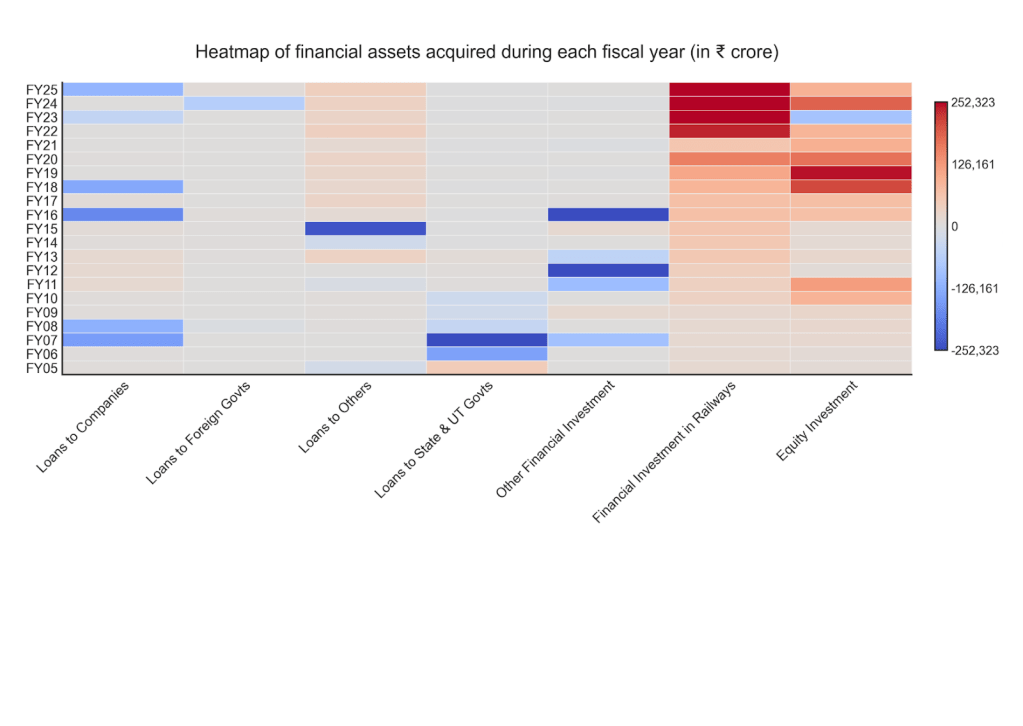
The heatmap of financial assets acquired during the year reveals a highly concentrated and instrument-led pattern of capital deployment, rather than a broad-based expansion across categories. A small set of components, most notably investments in railways and equity, account for the bulk of variation over time and largely determine the scale of financial asset acquisition. These instruments display clear phases of acceleration, particularly in the post-FY2020 period. Over successive five-year intervals, the CAGR of total financial assets rises from 6% and 5% in FY2005–10 and FY2010–15 to 14% and 13% in FY2015–20 and FY2020–25, driven disproportionately by a surge in equity investments, with CAGR peaking at 27% in FY2015–20, and a steady increase in railway investments, reaching 21% by FY2020–25.
This concentration reflects a strategic use of financial instruments to pursue specific policy objectives. Equity injections have systematically supported public sector undertaking (PSU) recapitalisation, most notably through the Indradhanush plan’s ₹2.11 lakh crore infusion into public sector banks during 2017-20, alongside targeted equity for power and rail PSUs to bolster balance sheets under fiscal constraints. Railway investments, meanwhile, align with mission-critical infrastructure priorities under the PM Gati Shakti framework, channeling ₹2.5 lakh crore in annual capex post-2021 to accelerate Dedicated Freight Corridors and high-speed rail projects.The implications, however, are more complex. First, such concentration narrows the allocative base of public investment. When a large share of financial resources is channelled through a few instruments or sectors, it limits diversification and may crowd out alternative uses of capital, particularly in sectors that lack comparable institutional or political salience. Second, it weakens the signalling role of public investment. Aggregate increases in financial assets may primarily reflect recapitalisation or sector-specific pushes rather than a broad-based expansion in economic capacity, making it harder for private investors to interpret public investment trends as signals of widespread demand or opportunity. Third, the returns to such investments are uneven and often indirect. While railway investments can generate strong spillovers, repeated equity injections into stressed entities may yield low or delayed returns, raising concerns about capital efficiency and fiscal risk. Further, the concentration amplifies volatility in aggregate trends. Loan-based components, which are sensitive to repayments and accounting adjustments, introduce fluctuations that can mask underlying investment momentum. This reduces the reliability of year-on-year changes in financial assets as indicators of sustained capital formation. Over time, this pattern risks entrenching a form of fiscal intermediation that prioritises balance sheet support and sector-specific interventions over broad-based capital deepening.
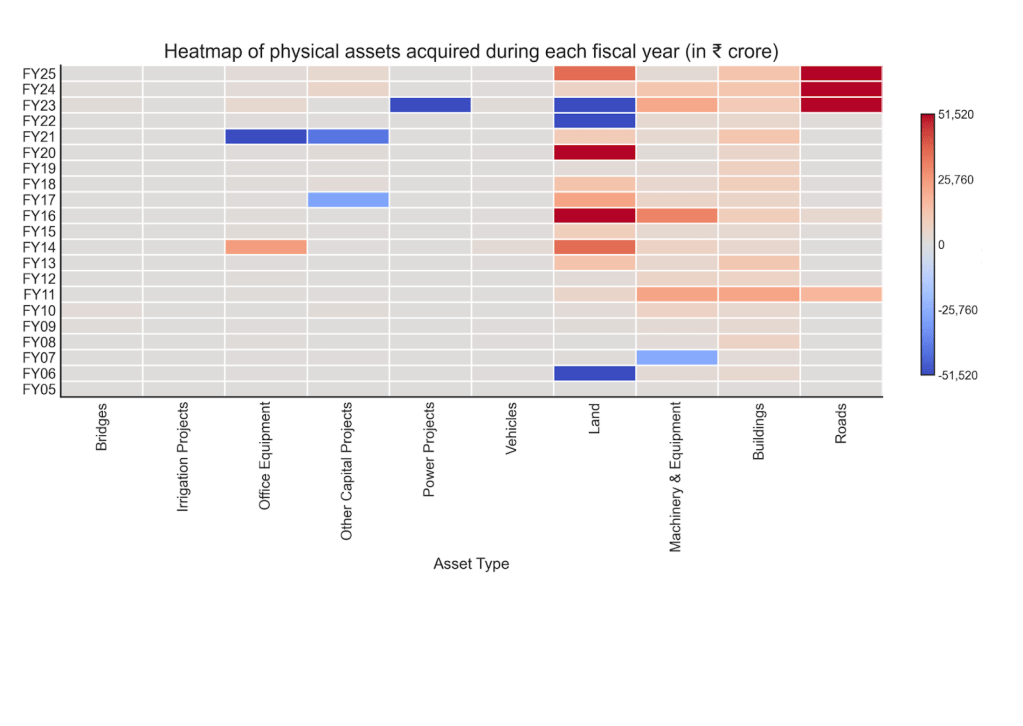
The heatmap of physical assets acquired during the year points to a concentrated and uneven pattern of infrastructure creation, where a few categories disproportionately shape overall trends. In particular, roads have emerged as the primary driver in recent years, with a sharp escalation post FY2022-23 that accounts for a large share of the increase in total physical assets. This is reflected in growth patterns as well. When examined using five-year interval CAGR (FY2005-10, FY2010-15, FY2015-20 and FY2020-25), overall physical assets rise from 7% and 6% in the first two intervals to 16% and 14% in the latter two, alongside a pronounced shift in road investments- from a contraction of -4% in FY2010-15 and subdued growth of 3% in FY2015-20 to a sharp surge of 101% in FY2020–25. Land also exhibits significant but highly volatile movements, including large positive spikes (e.g., mid-2010s and FY2020-21) alongside negative values (sale) in later years. Machinery and equipment show intermittent peaks, indicating project-linked investments rather than sustained capital formation. In contrast, core infrastructure sectors such as irrigation, power, bridges, and buildings remain persistently low and relatively flat over time, with no comparable scaling. When assessed through five-year interval CAGR, bridges record a sharp one-time spike (183% in FY2005-10) before flattening to 1-2%, irrigation moderates from 15-33% to 1-6%, and power declines from 58% to -3% by FY2020-25.
These patterns raise concerns about the breadth, balance, and sustainability of physical capital formation. The dominance of roads in recent years suggests a sectorally concentrated infrastructure strategy as under the Bharatmala Pariyojana, which, while important for connectivity and growth, does not substitute for broader investment across complementary sectors. Further, the persistently low and stable levels of capital investment in sectors such as irrigation, power, and buildings point to potential gaps in foundational and social infrastructure, which are critical for inclusive growth and service delivery. Although the current prioritization of capital expenditure in road infrastructure is a welcome development, a similar shift in agriculture and manufacturing — transitioning from revenue-based support mechanisms such as subsidies and incentives to consistent capital outlay — holds considerable potential for sectoral advancement. In addition, the absence of sustained growth across categories suggests limited progress toward deepening capital formation, with increases in physical assets driven by isolated expansions rather than systemic strengthening. This finally feeds into India’s economic or service delivery outcomes too.
Taken together, the evidence points to a pattern of asset formation that is expanding in scale but remains uneven in structure and composition. Growth has been episodic rather than sustained, with aggregate trends increasingly shaped by a narrow set of financial instruments and select physical sectors such as roads. This concentration, alongside the volatility observed in key components, suggests that capital formation is not yet broad-based or consistently anchored in long-term capacity creation. As a result, headline increases in asset acquisition may not fully translate into durable gains in productivity, infrastructure depth, or inclusive economic development.
Although the asset register holds significant promise in guiding India’s economic development, gaps in how assets are recorded and classified continue to distort the overall picture. These limitations complicate an accurate assessment of the scale, composition, and effectiveness of public investment, warranting closer scrutiny of the underlying data systems.
Limited Transparency and Data Gaps Persist
The Asset Register Statement, as prepared and presented with the Union Budget, is not wholly in compliance with the format prescribed by the FRBM Act. For one, the Act mandates that the land area (in square kilometres) be mentioned in brackets against the land asset value. However, if land area is unavailable, the Statement must provide a target date to provide the same in footnotes. This requirement has not been met in any of the Asset Register Statements till date.
The CAG, in its annual review of the Central Government’s compliance with the FRBM Act, has also repeatedly flagged gaps in transparency in the maintenance and presentation of the Asset Register Statement. In its 2021 Compliance Audit, the CAG flagged errors in measurement of assets by various Ministries, to the extent that assets were overstated by ₹590,875 crore in the Statement of Receipt Budget FY2020-21.
In its FY2023-24 report, the CAG noted that figures pertaining to financial assets — specifically loans outstanding from Foreign Governments, States, and Union Territories — as reported in the Asset Register Statement, did not align with the corresponding figures in Statement of Assets (Capital Investments and Loans by the Central Government) (Statement No. 1(ii)) of the Receipt Budget 2025-26. This discrepancy is particularly notable given that both statements form part of the same budget document. This observation is recurrent in past CAG Reports as well. The following table illustrates this discrepancy. In the Receipt Budget of FY2025-26, loans to states and UTs stood at ₹5,111 crore at the end of FY2023-24, as per the Asset Register. However, as per the Statement of Assets, these loans stood at ₹623,358 crore. Thus, both statements reflect a discrepancy to the tune of ₹618,246 crore. Similarly, the two Statements when compared reveal a discrepancy of ₹1,393 crore in the accounting of loans to foreign governments at the end of FY2021-22, in the Receipt Budget of FY2023-24.
| Table 1: Discrepancies between Asset Register and Statement of Assets | |||
| Fiscal Year | Statement | Loans to States and UT Governments | Loans to Foreign Governments |
| At the end of FY2023-24 (as given in Receipt Budget FY2025-26) | As per Asset Register | ₹5,111 crore | ₹15,202 crore |
| As per Statement of Assets | ₹623,358 crore | ₹16,676 crore | |
| At the end of FY2021-22 (as given in Receipt Budget FY2023-24) | As per Asset Register | ₹4,931 crore | ₹15,855 crore |
| As per Statement of Assets | ₹492,213 crore | ₹14,462 crore | |
And finally, one of the most puzzling transparency gaps recurrent in successive Asset Register Statements is that of the mismatch between the closing figure of cumulative assets at the end of a fiscal year, with the opening balance of assets at the start of the next fiscal year. The CAG has also flagged this issue in its compliance audit reports. The following table illustrates this issue.
| Table 2: Discrepancies between opening and closing figures of asset valuation | |
| Cumulative Assets at the end of FY2022-23 (closing figure of FY23) | ₹2,632,442 crore |
| Assets at the beginning of FY2023-24 (opening figure of FY24) | ₹2,634,305 crore |
| Cumulative Assets at the end of FY2023-24 (closing figure of FY24) | ₹3,045,548 crore |
| Assets at the beginning of FY2024-25 (opening figure of FY25) | ₹3,119,002 crore |
Ideally, the closing figure of FY2022-23 should be carried over as the opening figure of FY2023-24. However, as can be seen from the table, the two consecutive Statement of Receipt Budget 2024-25 and 2025-26, showed a discrepancy of ₹1,863 crore between the opening and closing figures of asset valuation. Similarly, the opening balance of assets for FY2024-25 was greater than the carry-over balance of assets at the end of FY2023-24 by ₹73,454 crore, an increase of 2.5% in asset valuations, between values which should have ideally been equal. Although small, these discrepancies are recurrent, reflecting measurement errors which renders data incomplete and incomparable. This hampers long-term fiscal planning and transparency.
In its 2021 FRBM Act audit report, the CAG flagged these variations and the inadequate explanation the government provides for these, in the footnotes. The footnotes did not provide an item-wise reconciliation of the variations, but only specific instances without quantification to explain the gap. This practice has improved in recent years. In its latest Asset Register Statement, the government explains that the closing and opening balance gap of ₹73,454 crore is primarily attributable to two factors. First, the Ministry of Civil Aviation accounts for a difference of ₹62,408 crore, owing to the non-inclusion of equity infusion pertaining to AI Assets Holding Limited (AIAHL) for FY2021-22 in the preceding year’s Asset Register. Second, the Union Territory of Ladakh accounts for a difference of ₹11,385 crore, arising from the bifurcation of assets in FY 2023-24 following the UT’s creation. Aside from these, some Ministries have reported that gaps may exist due to “inadvertent errors” and upgrades to data systems. The Statement clarifies that because figures are compiled on the basis of what is reported by Ministries, they may be subject to variation due to reconciliation, liquidation, adjudication, or administrative decisions related to asset valuation, as well as efforts to improve data capture.
That the need to improve data transparency is acknowledged and iterative and ongoing efforts to make successive Asset Register Statements of superior data quality are sustained, is a welcome development. However, without a standardised and comprehensive format to develop asset registers, asset valuation data runs into issues of non-comparability and incompleteness. In the times of artificial intelligence and tech-enabled public financial management systems, India must define a best practices-aligned and standardised mechanism to develop and maintain asset registers.
What is the Way Forward
As per, the International Monetary Fund’s Public Investment Management Assessment (PIMA) Handbook an asset register is a “documented list of fixed assets”, providing information on the physical assets held by each department, their location, date of acquisition, disposal status, asset type, and current valuation, among other details. Physical asset registers, therefore, serve as the basis for the calculation of non financial asset valuation. This corresponds with IMF’s Government Finance Statistics Manual (GFSM) 2014 definition of capital spending as “net acquisition of non financial assets”. Thus, per international standards, capital spending and asset registers include physical assets only, as these represent long-term stores of value de-linked with market valuations. India, however, contrary to this internationally-recognised PFM best practice, includes financial assets in both its asset register and its calculation of capital expenditure. India should therefore, align its fiscal terminology and measurement definitions with internationally-aligned best practices, and restrict Asset Registers to physical assets only.
The PIMA Handbook also emphasises on the importance of measuring depreciation or consumption of fixed capital in the valuation of fixed assets, serving as an important indicator of required reinvestment of future capital to maintain asset valuations. However, because government accounting in India is done on the cash-basis, meaning transactions are recorded only when cash changes hands, depreciation of government assets is not recorded in our Finance Accounts. Thus, our current assets register is unable to provide any information on how much of the fixed assets have worn out, and how much must be allocated in the future to replace them. India’s slow progress towards adopting accrual-principles of accounting which would institutionalise depreciation measurement, despite the Government Accounting Standards Advisory Board (GASAB) having designed accounting rules and a way forward based on accrual-accounting, including several pilot projects, needs an urgent relook.
Similarly, GASAB has also developed a Guidance Note on fixed assets accounting, in an effort to consolidate the maintenance of different types of assets, as prescribed in several formats by the Government Financial Rules, into one comprehensive assets register. This format, it recommended, would bring better accountability and decision-making to the management of fixed public assets. This set the stage for further discussions on developing e-Asset Register, as recommended by the Expenditure Management Commission in 2014. The Controller General of Accounts (CGA) developed guidelines for the shift to e-Assets Registers, which were to record every asset of more than ₹5,000 with a life of more than twelve months when acquired, including capital works currently in progress. In addition to the fixed assets already recorded in the extant Asset Register, the e-Asset Register was envisioned to include heritage assets such as artefacts and paintings, arms and ammunitions and intangible assets such as patents and copyrights. The guidelines also prescribed routine physical verification of assets, and appropriate updation of the Register. Moving toward e-asset registers offers a critical pathway to strengthen transparency, standardisation, and real-time fiscal management. However, their largely fragmented and manual implementation constrains data reliability and limits their utility for fiscal decision-making. Transitioning to a digital (e-asset) system would require three key shifts: first, the establishment of a centralised, interoperable digital platform that integrates asset data across ministries and aligns with financial management systems such as PFMS; second, the adoption of standardised data protocols, including unique asset identifiers, geotagging, lifecycle tracking (acquisition-maintenance-disposal), and periodic reconciliation to address discrepancies; and third, the strengthening of institutional capacity and audit integration, ensuring ministries regularly update, validate, and reconcile asset data in line with accounting standards.
Extending these best practices to the State and local levels is not merely beneficial but necessary, given that the scale of government assets at the sub-national level is substantial. Deepening asset knowledge across both Central and sub-national levels is therefore essential to reveal India’s true asset formation status — and to unlock the full economic and fiscal potential that a unified, decision-relevant public asset framework can offer.This would support the effective governance of India’s public assets by requiring that governments maintain current knowledge of the location, condition, and utilisation of their assets at all times. Timely upkeep can extend asset life and enhance service potential, while robust recording and regular review of asset registers can safeguard against misappropriation and loss. However, realising these benefits requires that asset registers move beyond their current role as compliance artefacts and become active inputs into budgeting cycles, expenditure planning, and capital investment decisions. The opportunity cost of the current system is significant — without a fully functional, standardised, accrual-based asset register, India foregoes better maintenance planning, more efficient asset allocation, and reduced fiscal leakage across government organisations. Reliable asset information must therefore be institutionally embedded in fiscal decision-making processes — not merely maintained for audit and compliance purposes — to support both short and long-term service delivery planning. Robust and well-designed Asset Registers, potentially at the general government level, backed by a clear pathway to inform fiscal decisions, can provide pathways to unlock further economic potential in the country.

Leave a comment